Welcome

Welcome. I am the author of Universal Time, a sci-fi urban comedy;
Beaufort 1849, an historical novel set in antebellum South Carolina;
and In the Land of Porcelain, an urban comedy set in present-day San Francisco.

Sunday, January 13, 2013

Looking into the Crystal Ball: Predictions for 2013


I’ll start off with the easy stuff, continuations of trends already in progress.

1. Young people turn urban.  The under 30 crowd will continue to flock to urban areas, eschew car purchases, bicycle in ever-larger numbers, as well as walk, take transit and use a car sharing service from time to time.  This means in 2043, 50-somethings will be in much better health than they are today.

2. Oldsters turn urban. Boomers between the ages of 50 and 70 will downsize, abandon suburbia and head for urban areas where there is more to do and less lawn to mow. They will bring their cars with them and then be grouchy they can’t park anywhere.

3. Housing prices uneven. Housing in urban areas on the US coasts will appreciate slightly on average while housing in distant suburbs of the same cities will continue to lose value.

Up, up, up
4. Some difficult trends continue. As in 2012, in 2013 food stamp use will again increase in the US, the average price for a gallon of gas in will again be higher than the previous year, the Gini Index measure of inequality will again rise in the US, and median real household income will again decline.

5. Turmoil in the Middle East and North Africa. (Not a hard call!) Specifically, there will be turmoil in countries that have recently transformed or are in the process of transforming from net oil exporter to net oil importer. The exporter to importer transition creates upheaval not only because an important source of revenue dries up but also because precious hard currency now has to buy energy imports, wreaking even more havoc with balance of payments. Middle East and North African countries likely to encounter turmoil (or more turmoil) are Egypt, Syria, Yemen, and Tunisia. Other countries that might experience turbulence are Argentina, Uzbekistan, Indonesia, Malaysia, Vietnam, and the United Kingdom. Might even see a little upheaval in Denmark.

2012 was painful enough
6. Serious oil import pain.  These countries will drop oil imports by more than 5% in 2013: Greece, Portugal, Spain, Italy, Ireland, UK, Poland, Hungary, Bulgaria, and Syria. This will largely be due to painful economic necessity and occur through drops in passenger miles traveled rather than through investment in energy-efficient mass transit. The countries in the graph above already dropped by 5% or more in 2012.

7. Moderate oil import discomfort. These countries will drop oil consumption by 1 to 5%: USA, Belgium, Netherlands, Finland, Sweden, Austria, Germany, and France. In most of these countries (except the US), wasteful oil use has already been curtailed so consumption will drop primarily through increased investment in and use of public transportation. This will improve the economic performance of these countries. In the US oil consumption will drop through greater vehicle efficiency, fewer miles traveled, and a moderate amount of increased public transit use. To achieve the transportation efficiency of most European countries, US oil consumption will eventually have to drop in half, and miles traveled by private vehicles will eventually have to drop two-thirds. This will happen, but not next year.

8. Still on the upswing. Countries that will increase consumption by more than 1%:  Canada, Australia, South Korea, Japan, Mexico, Turkey, Vietnam, India, Brazil, Thailand, Argentina, Iraq, Venezuela, Libya, Saudi Arabia, Qatar, Iran, Jordan, Turkmenistan. Most of these countries are oil producers who have long subsidized oil sales to placate their populations. (Once a country subsidizes anything, removing the subsidy is difficult.) Some countries, such as Turkey, Brazil, Vietnam and Thailand, are still expanding economically, have a lot of population, have historically used very little oil, and get a lot of economic return from even small additional amounts of oil used.

9. Solar booming in some places. California will continue to outpace the rest of the US in rate of solar PV installation. Germany will continue to outpace both California and the US for same.

10. The US will not run a balanced budget in 2013. A hamster could predict this.

11. The Federal Reserve will continue to monetize US government debt. The hamster’s sister could predict this.

12. The US economy will continue to slowly contract as households with at least one member unemployed will “insource” domestic tasks rather than purchase/hire them for pay. Outsourcing of shopping, cooking, gardening, sewing, laundry and childcare, which caused apparent economic expansion when women entered the work force in volumes in the 80s and 90s, will become again part of the domestic, uncounted, economy. (The amount of real work done, however, won’t change.)

13. Some will do better than others. US cities that offer attractive alternatives to fossil fuel-powered transportation—safe routes to walk and bike, electrified trams, metros and buses—will be have stronger economies in 2013 than those that don’t because less consumer spending will immediately leave their economies. (The exceptions will be cities directly involved in the gas and/or oil business.)
  
Somewhat dicier calls:
1. Greece or Germany will leave the Euro. (One or the other.) If Greece goes, likely Spain will leave as well. 
2.   Oil exports from Mexico plus Venezuela will decrease as much as oil exports from Canada increase.
3. US consumption of oil and coal will drop by 5%. US consumption of natural gas will increase by 4%. 
4.  Each region of the US will have a period of gasoline supply troubles, either due to weather, other natural disaster, or refinery capacity. These incidents will cause shortages or gasoline prices at the pump above $5/gallon. 
5.   Japan’s economy will come apart at the seams, in no small part due to having to import fossil fuels to meet a large portion of their energy needs. (But this doesn’t mean their society will follow suit, seam-wise.) 
6.   China’s economy will flatline, going neither down nor up in 2013, although with their population, this means running pretty fast just to stay in same place. 2014 is a question mark. China's smog and pollution issues will grow so dire that they will actually not increase coal consumption in 2013. 
7.  If the Middle East remains stable, US oil production will plateau in 2013 due to high production drop off rate of tight oil wells (oil production in North Dakota.) US production of natural gas will drop due to reduction in natural gas well drilling and sharp well depletion rates. 
8.  If the Middle East becomes chaotic enough to disrupt oil production (possibly due to high worldwide grain prices resulting from US Midwest drought and/or US corn ethanol production), oil prices will sky rocket.  This will cause oil that is currently uneconomic to drill and pump in the US to suddenly become economic. In that scenario, US oil production would increase while overall US oil consumption would drop. 
9. The deduction homeowners can take off their taxes for mortgage interest will be reduced (possibly just for upper incomes) or dropped altogether. 
10.  Fearing political backlash, Congress will still refuse to raise the gas tax or even index it to inflation. Instead, road repair and maintenance will continue to be paid for with debt. Individual states, however, will begin to raise state gas taxes in 2013. 
11. The Midwest drought will raise the price of ethanol so much that everyone except corn farmers will curse the mandated 10% ethanol content in gasoline. The amount of corn going into ethanol will also raise the price of animal feed which will raise the price of meat and dairy. However, if high grain prices actually cause revolutions in oil-producing countries, ethanol may again seem cheap in comparison to oil.

Medium term, the items below can’t continue because we will no longer be able to afford the squandering of resources and/or absorb the harm inflicted. One way or another they’ll be gone/kaput by 2018, but they may still wreak havoc in 2013: 

1.   US spending 18% of GDP on health care.  (Other wealthy countries spend 11.5%)
2.   US spending 5% of GDP on military. (Other wealthy countries spend 1.5%)
3.   US debt 106% of GDP
4.   Ethanol 
5.  War on drugs 
6.   $1 trillion dollars in student debt
7.   One third of Americans obese  
8.   11% of US adults diabetic 
9.     Internal combustion engines (due to gross inefficiency--over 75% of energy input lost) 
10. High fructose corn syrup 
11. Coal-burning power plants 
12.  Freight shipment by methods other than water or rail (and perhaps electric truck for the last few miles.) 
13. Average of 845 square feet of living space per person in the US. 
14. Over-use of air conditioning and air conditioning of the outdoors

The above mean these parts of the economy will shrink/diminish over the next five years: health care, prisons, brick and mortar college education, military, corn farming, coal mining, diesel trucking, airfreight, air transport, road building.

These areas will expand/increase over the next five years: farming of all products other than corn, on-line education, renewable energy, electrical power grid expansion and upgrade, rail and transit construction and maintenance, rail and transit operation, rail freight, bicycles, electric bicycles, energy-efficient housing, energy efficiency retrofits, housing near transit/in urban settings.

Sunday, January 6, 2013

Drunk Driving in San Francisco

I love data and the stories it can tell us. But one data point that saddens me is that two weeks ago in San Francisco a drunken 23-year-old woman hit three Chinese tourists with her car and killed one of them. The driver, who had three passengers in various states of inebriation with her, left the scene (hit and run) but was later apprehended by the police. At the very least, this is a terrible way for the city to treat its tourists. But it made me consider just how prevalent a problem drunk driving is in San Francisco and how well or ineptly we are dealing with it.

Let’s look at the data. First off, overall crime has been decreasing in San Francisco the last ten years. This has been true in big cities nationwide, but murders, assaults, rapes and robberies are all down in San Francisco, so let’s give our police department and judicial system some credit.

However, one statistic isn’t down in San Francisco—fatalities and injuries due to alcohol-related collisions. The number of alcohol-related fatalities have held steady the last five years and alcohol-related injuries are actually up. In 2010, there were 50 murders in San Francisco and 32 traffic deaths. 41% of those traffic deaths involved alcohol. (Statewide the number is 39%.) In 2010 there were 2386 assaults and 4788 traffic injuries. (Traffic injuries tend not to be reported unless they warrant a trip to the hospital where a report is filed.) 10% of those traffic injuries involved alcohol. (Statewide the number is 10.6%.) So you can see as violent crime rates come down and alcohol-related traffic fatalities and injuries don’t, alcohol-related traffic issues grow in significance.

So then we might wonder, just how tough is San Francisco on alcohol-impaired driving?  It turns out that while California has some of the stricter DUI laws in the US, San Francisco is one of the laxest counties in the state when it comes to enforcement. In a 2011 DMV report, “An Evaluation of Factors Associated with Variation in DUI Conviction Rates Among California Counties,” that evaluates data from 2000 – 2006, it turns out that the county of San Francisco is the fifth worst of all 58 California counties in DUI conviction rates. Our conviction rate is 58.2% while Marin County’s is 85.8 and San Mateo County’s is 76.7. (It turns out that Marin has a remarkably low alcohol-related fatality rate—only one death in all of 2010.) 

And San Francisco has the lowest, let me repeat, lowest DUI arrest rate of any county in the state. In 2006 it was .3 per 100 licensed drivers.  In 2010, it was still .3. The statewide average is .9. In 2010 fewer DUI arrests were made in San Francisco than the previous two years (2008—1483, 2009—1534, 2010--1480.) And we have the highest rate in the state (10.4%) of letting DUI-arrested people plea bargain down to “dry reckless,” meaning a reckless driving charge with no alcohol-related penalties, points or priors involved. And we have a very high rate (13.6%) of letting DUI arrested people plea bargain down to a “wet reckless” charge, meaning an alcohol-related reckless driving charge. Neither “wet reckless” or “dry reckless” plea bargains involve license suspension at all. (For a troubling look at how San Francisco lawyers help DUI-arrested people plea bargain down, see here.) Drivers for whom San Francisco allowed “wet reckless” plea bargains had a mean blood alcohol content (BAC) of .112, well over the legal limit of .08! The people actually convicted of DUIs in San Francisco had a mean BAC of .169, more than double the legal limit! (The San Francisco archbishop who was arrested this last October for a DUI with a BAC of .11 plea bargained down to a “wet reckless” which meant a fine, probation and no license suspension. Because, you know, a license suspension would be inconvenient.)
Stricter blood alcohol levels

Note than in Sweden and Norway the legal limit for blood alcohol content is .02. Over .02 and you get your license suspended for three months. In San Francisco we don’t give DUIs unless the person is so drunk he/she basically can hardly put their keys in the ignition.

Calibrate the darn thing
And then we have the issue last spring of probable faulty calibration of the breathalizers used to determine blood alcohol content levels. This sloppiness by SFPD may result in over a thousand DUI cases since 2006 being overturned. Honestly, it’s pathetic.

The study mentioned before found that counties with low DUI conviction rates (of which San Francisco was one) had a 45% higher rate of alcohol-related crashes and injuries than in counties with high DUI conviction rates. The 2012 Annual Report of the California DUI Management Information System shows that statewide 3.1% of DUI first offenders had crashes within a year after their conviction, while only 1.9% of second offenders (who routinely receive much harsher penalties) had crashes within a year of their second conviction. Of course, this may be due to the fact that second offenders get their licenses suspended for a much longer period of time. (No license = fewer crashes.)

The 2012 Annual Report mentioned above shows the findings of a 1994 study which determined that 24% of first-time DUI offenders will incur another DUI incident within the next 8 years. It also shows that at the end of 13 years, 30% of male DUI offenders had reoffended as compared to 21% of women DUI offenders. (87% of all DUI offenders in 1994 were male. In 2009 close to a fourth were female.) DUI recidivism did use to be much higher before 1980. The drop is largely attributable to the implementation in 1982 of tougher sanctions on DUI offenders and implementation a lower legal blood alcohol limit. The report also offered up findings that show that assigning alcohol-reckless drivers to a either a 3 month or 9 month DUI intervention program has very limited effect on 1-year crash rates or further DUI incident rates.

So who is causing the fatal crashes, first timers or chronic drink and drivers? In 2009, 69% of drivers arrested in alcohol-involved fatal crashes had no prior DUI or alcohol-related reckless driving convictions. (Though in San Francisco they might have effectively plea-bargained down to “dry reckless” which wouldn’t have shown up in the data.) Another 24% involved drivers with one prior. When you throw into the mix the fatal crashes of drivers who had been drinking (according to the crash report) but were not even arrested, 74% of all alcohol-related fatal accidents involve no prior DUI, and 19% involve a driver with one prior. The chronic recidivists account for only 7% of fatal accidents.

It is interesting to look at alcohol-related injury and crashes—who is responsible and when they happen. In 2010 in California, alcohol-impaired men between the ages of 18 and 32 killed at a rate 5 – 8 times that of alcohol-impaired women.  However, after age 32, men killed at rate only 3 times that of women. Peak age for alcohol-impaired driver to kill someone:  24.  Peak age to injure someone: 21.  Peak age for driver to be killed: 24.  Peak age for driver to be injured:  21. Peak age for passenger to be killed in a collision involving alcohol: 21.  Peak age for passenger to be injured: 18.  Peak ages for pedestrians to be killed in a collision involving alcohol:  29, 46, and 58. (Not sure why there should be three mini peaks?) Peak age for a pedestrian to be injured: 22. Peak age for a bicyclist to be killed in a collision involving alcohol: three peaks at 21, 46 and 52.  (Obviously people who are 46 years old should watch the heck out.)  Peak age for bicyclist to be injured: 24.

When the fatal accidents occur
Alcohol-related fatal collisions in California are most likely to happen at 2am Saturday morning, but actually all Saturday evening and the wee hours of Sunday morning are pretty darn bad, as is Friday evening/ early Saturday morning. What’s surprising to me is how bad Sunday evening is from 5pm to 10 pm—worse than Friday from 5 pm to midnight.

Now let’s look at San Francisco public health in general. First the good news—San Franciscans are a healthy bunch, much healthier than the US average! Our men on average live 77.7 years, 2.3 years more than the US average, and our women live to 83.6 years, 3.2 years more than the national average. We have a much lower cancer rate than the national average, lower rates of chronic liver disease, coronary heart disease, diabetes (half the national rate!), Alzheimers, breast cancer, prostate cancer, and lung cancer. However, we have more drug-related deaths than average and more homicide deaths than the national average.  We are equal to the nation’s average for firearm-related deaths and suicides. Children don’t tend to die at high rates in general, but for children in San Francisco ages 1 – 4, motor vehicle accidents are tied for the second leading cause of death. For children ages 5 – 14, motor vehicle accidents are tied for fourth. For persons aged 15 – 24, violence/assault is the leading cause of death, self-inflicted injuries come in second, and motor vehicle accidents are the third. For ages 25 – 34, violence/assault and self inflicted injuries are again one and two, and motor vehicle accidents are down at number 5. By age 35 people really start dying of enough different causes that motor vehicle accidents don’t make the top ten.

Your liver should not look like this.
(Just as an aside, I have to say from the data, if you’re 35 – 44 and can manage not to unintentionally overdose yourself with drugs, not commit suicide, not abuse drugs, not abuse alcohol, and not get hit by a car, you stand a very good chance of living to see 45. And if from 45 – 54 you can take it easy on the drugs and alcohol, not get hit by a car, and not commit suicide, you will very likely make it to 55. After 55, heart disease kicks in, but if you’ve been walking and biking the preceding years you’ll be protected from that, so again taking it easy on the drugs and alcohol will really increase your odds of making it to 65. I am just amazed how many San Franciscans die of cirrhosis of the liver, though it's true some could be due to hepatitis. But it’s pretty much all men. Very few women die of cirrhosis or alcohol abuse.)

So why am I putting so much effort into research and writing this? Do I hate alcohol? Do I just want no one to have any fun? Actually I’m very fond of a nice glass of wine, and philosophically I am against prohibitions of all kinds. When it comes to substances/items/behaviors that create public health risks, I favor policies of regulation, taxation and concerted education campaigns rather than making the substance/item/activity illegal. Yes, I have friends and family members who have died or suffered tragedy due to traffic accidents and drunk driving. I would be extremely surprised if anyone reading this has not.

But to go even further, the more I look at the data surrounding DUIs in San Francisco, the more appalled I am. Since my family does not drive much, my family members and I are often out on the streets of San Francisco walking, biking or waiting to take transit. This makes us vulnerable to irresponsible vehicle drivers. In fact, because members of my family walk and bike so much we are generally fit and healthy enough that a traffic accident will be the most likely cause of our early death! This is especially true for my children. And since 40% of all traffic fatalities in San Francisco involve alcohol, you bet this concerns me. Though we’d rather not face it, cars kill more people than guns do in the United States. In 2010, firearms killed 31,513 people, 19,308 of which were suicides. Traffic accidents killed 32,788. If you are not suicidal, you are far, far more likely to be killed by a car than a gun.   

Some countries drink and don't kill
Now guns kill almost nobody in Europe, but cars also kill way less people there. (Yes, it's people who shoot the guns, and people who drive the cars.) The traffic fatality rate in Sweden is one fourth of ours. Yes, they drive less, but even their fatality rate per vehicle mile traveled is 40% of ours. And they consume more alcohol per capita than we do! The traffic fatality rates of the Netherlands, Finland, Denmark, Switzerland and Norway are 34%, 48%, 43%, 41%, and 41% of ours respectively, and all but Norway consume more alcohol per capita than we do. (The Finns and the Danes drink 30-40% more!) Traffic accidents cost the US $300 billion dollars a year, of which less than half is paid for through drivers’ insurance premiums. The rest is shouldered by all of us through increased health care premiums, increased Medicare costs, increased emergency personnel costs, clean up costs, and lives lost. If licensed drivers in the US were to pay the full cost of all the accidents motor vehicles incur, each would pay an additional $1500 per year. When you think about it, that is a pretty hefty subsidy.

Cars are powerful, dangerous and heavy. Their mass combined with potential for extremely fast acceleration is not to be taken lightly. Monetary penalties and points on a license are not sufficient deterrents to irresponsible driving, especially when it is so easy to reduce these penalties on the first offense. Besides, we don’t need reckless drivers to be poorer—we need them off the road until they truly commit to driving more responsibly. The penalty for irresponsible, reckless driving should be significant license suspension (90 to 180 days) rather than monetary penalties, alcohol programs (which don’t work) or even jail time. And the suspension needs to happen the very first offense. (In addition, driving with a suspended license or without a license should result in the car involved being permanently impounded.) License suspension is the one penalty that drivers fear enough to actually change their behavior. But because we’ve by and large designed our way of life around car driving, because we consider driving a necessity rather than a privilege granted only to responsible people, it is tragic that the one penalty that might reduce reckless driving and save lives is the penalty our court system is most loath to hand out.

Wednesday, January 2, 2013

Conquer Twin Peaks and Stand on the Rooftop of San Francisco


San Francisco is a scenic city. It just can’t help itself. Vistas with ever-changing combinations of bridges, fog, sunlight and water can bewitch and bemuse even the most jaded long-time resident. We all have our favorite beguiling corners of town, but for spectacular 360-degree views, the two hills rising in the city’s very center cannot be beat. (Except, of course, on those days when they are entirely shrouded in fog. Even then it has its allure.)

Twin Peaks rises to 922 or so splendid feet, beaten out for highest point in the city honors by Mount Davidson by a paltry six feet. But though Mount Davidson might be tallest, it offers nowhere near the views. 

There are many modes of transport to Twin Peaks—by car, tour bus, or even by bicycle. But if you are willing to make the effort, getting to the roof of the city on foot is a uniquely jubilant, exhilarating experience. Though you might think it would be an ordeal to scale mighty Twin Peaks under your own power, it’s really not that bad of a walk—it takes only 40 or 45 minutes. (You might even call it a nice afternoon stroll with a bit of a hike at the end.) To help you on your way, I will outline a route that is both scenic and the easiest climb up the hill.  After a certain point, it’s also quiet and almost car-free, allowing a nice separation from the hustle and bustle of the city below.

Castro Muni Station
Walkway from station
First off, take the Muni underground (or the scenic F-line if you’ve got time to burn) to the Castro/Market Street station. If you’ve never been to the Castro before, head down Castro Street to 18th, then turn right and walk up 18th Street to get your scenic fill.  (At Eureka you’ll join up with my preferred route.) If the Castro is old hat and you want a route with the least hill, make a hard left coming out of the Muni station, walk along the walkway that crosses above the station (Market Street will be directly parallel on your right.) 

Golden Winter Ginko
Cross Collingwood, continue along Market until Eureka. Turn left on Eureka and walk up Eureka to 20th street. On your way you may be lucky and see some vivid golden Ginko trees, their leaves scattered like silent haikus on the ground.

Victoriana
Your first stairs
At 20th Street turn right.  Now you’re going to really get away from cars. Enjoy the Victorian charm you come across.  At the top of this somewhat steep little block (at the corner of 20th and Douglass) you will see a staircase on your left.  Take it. You will pass gardens offering blooming plants, even on New Year’s Day (the date most of these photos were taken.)   


Take these, too.
Up you go
At the top you will see another staircase across the street. Take it. At the top of these stairs veer left and walk along (and above) Douglass until Romain Street. Turn right on Romain. Go a block and half admiring small gardens along the way.  At Market Street you’ll see a barrier in the center that prevents pedestrians from crossing.  But this is not a problem because on your right is a very pleasant pedestrian overpass with an easy curling ramp. Take it up and over Market Street. If you turn around, you’ll get your first glimpse of views but these are minimal compared to what lies ahead.  

Romain garden
After the overpass you’re on a lovely quiet block with gardens, few cars and no overhead wires. Take this to Corbett where you will turn left. On your right will be the aptly named Rooftop Elementary School and their sparkling glass tile murals. 

The correct stairs
Walk along Corbett to Hopkins and then turn right. Yes, Hopkins is steep but it only lasts a block. You may see people who have just conquered Twin Peaks walking towards you. You will know them from the rosy glow of their satisfied faces. At the top of Hopkins, you will see a staircase. Don’t take this! Turn left on Burnett, walk 50 yards, look right, and take the staircase across the street you see there. This is the first of four consecutive staircases you’ll take. This is the trek part of your journey, although not the final hike!

Someone's always faster
The sidewalk speaks
The four staircases are kept swept and the foliage trimmed, by whom (the city or the neighbors) I don’t know. If you’re lucky someone will leave you sidewalk poetry to peruse. There will undoubtedly be someone ascending these stairs faster than you.  (They may even be jogging up them. Your mind will boggle.) That’s all right. Take your time. You’re almost at the top!

After the fourth staircase turn right onto Parkridge. Ahead you will see the first sign of real wildness, what the entire hill looked like once upon a time, a hillside covered with sage and brush.  Follow Parkridge to the left as it becomes Crestline and climbs a mild hill. When the road crests, look to your right where you’ll see a sign with a little hiker.  It looks like:

Now for the hike part. You are entering the Twin Peaks Natural Area managed by San Francisco Recreation and Park’s Department. These stairs require sure footing, but they don’t last forever. You can pause from time to time, turn slightly, and really see some views. 
Wood ties invite you


What's in your way
Where you want to go


 At the top, you will come to a path that runs along Twin Peaks Boulevard, the road that snakes around our Peaks. You will see two Peaks in front of you. The one to the north is Eureka Peak and is most popular with tourists.  The one to the south, Noe Peak, is right across the street from you, is slightly taller than its twin, and is my slight preference, though both are fabulous. To get to either you will have to get yourself over the concrete barrier and then cross two lanes of traffic.  (You might wonder why there isn’t an opening in the concrete barrier that would allow the many people on foot to cross between the two clearly marked hiking paths with ease. You would not be alone in your wonder.)  Luckily the cars on this road are few so crossing here is not difficult.

The final ascent
Hike up the last set of wood tie stairs.  At the top you get your reward--views, views, views, every way you look.  You can see four bridges (Bay, Golden Gate, San Rafael, San Mateo), Mt Diablo, Mt Tam and the Santa Cruz mountains.  You can see the Marin Headlands, Angel Island and Alcatraz. If it’s clear enough, you can see the Farallons to the west and ocean freighters steaming their way to China. As the sun descends a thousand windows in the East Bay briefly flame red with reflected light.  Just after sunset pearls of light appear on the bridges outlining traffic streaming in and out of San Francisco.

You can see:
 Or this:
Or this:
 
Be warned:  it’s usually windy up here. Proper attire for this walk consists of multiple layers that you can zip and unzip as you warm up or hit windchill. This is a fabulous place for sunsets but the wood tie stairs are not lit, so either bring a flashlight or leave before deep darkness descends.  The rest of the way down is quite well lit—even the pedestrian overpass has decent lighting. 

It doesn’t have to be a brilliantly clear day to make the walk worthwhile.  I’ve gone up half an hour before sunset as the front arms of a storm system moved into the Bay, and then watched the city and lower sky turn shell pink with massive grey clouds lurking above. Fabulous.

Mission Blue wonder
And there are other reasons to make the climb. Here, away from cars, city noise and city smells, you have as much as chance as anywhere in San Francisco to be in contact with the indigenous natural world of this tip of peninsula. The air is fresh, and if there are not too many people around, you’ll see and hear many different kinds of birds flitting among the hillside sage and lupine. One of Twin Peaks’ claim to fame is that it is home to the endangered Mission Blue butterfly. In fact, Twin Peaks is one of only five places in the world where the Mission Blue butterfly is known to still exist. Evidently Mission Blue butterflies are considered quite gorgeous by butterfly connoisseurs. Though I have yet to see one (having only recently become a regular visitor to Twin Peaks), since they are most likely espied between March and June I may succeed in the upcoming months.

On your way down, if you want a real “get away from it all in the heart of the city” experience you can connect up with the Mt. Sutro Open Space Reserve to the north where you can hike three or four miles through woodlands so dense only the distant roar of street noise let’s you know you’re still in a city. Or you can go down the way you came up. After you’ve crossed the pedestrian bridge on Romain, the shops and restaurants of Noe Valley lie ten to twelve minutes to your right and the shops and restaurants of the Castro await you ten to twelve minutes to your left. Since you have just conquered Twin Peaks on your own power and stood on the rooftop of San Francisco--an ascent you share with the ancients since humanity first arrived on these shores--you have well-earned the rosy glow of satisfaction and exhilarating memories of adventure that are now yours.

Tuesday, December 18, 2012

The Nine Best-Run Countries in the World, What They Have in Common, and What They Have to Teach the U.S.


How to be among the best?

For much of the twentieth century the United States could, quite factually, consider itself the most prosperous nation on earth. This, however, is no longer the case. While the US is not doing terribly, nine countries scattered over three continents are outperforming us along a wide variety of spectra. The nations in this “best-run” club all have higher levels of wealth, health and quality of life than the U.S. Though it’s hard to say definitively why they are healthy, wealthy and living so well, their public policy choices and infrastructure investments diverge significantly from ours. As we dig into their stats, we’ll see they share many traits in common.

Compared to the US, these nine countries are more egalitarian and less murderous. Per capita, they imprison far fewer people, and far fewer of their citizens die in road accidents. Their governments are less corrupt. Their cities are the greenest in the world and offer their residents advanced infrastructure, low crime rates, and high levels of security and stability. Each country as a whole saves more and has less debt per capita than the US. The populations of these countries own fewer cars than their US counterparts, and the ones they have they drive less. They take trains and transit, walk and bike at greater levels, and they spend less of their income on transportation as a household expense. These countries spend far less on their militaries and on health care than we do, but they spend far more at the pump for a gallon of gasoline. And all but one country achieve their high quality of life with less CO2 emissions per person than the US—many with less than half as much.

One might wonder if these countries are just as urban as ours? The answer is yes. Perhaps they are more homogenous and don’t have the challenges of assimilating immigrant populations? The answer is four have a higher percentage of immigrants than the US, one has comparable, and four have a lower percentage. Over half of these countries have vast, sparsely populated portions of countryside like we do. Four have rich mineral resources like the US does; five have almost none. Four are net energy exporters; five are net energy importers like the US. All but two have their own currency like the US does. All are democracies.

Who are these paragons of good national management? Norway, Switzerland, Australia, Sweden, Denmark, Finland, Netherlands, Austria and Canada. Let’s look closer at some of the surprising statistics that help us understand why and how these countries are doing so well. 

Wealth
These nine countries are in the very top tier of GDP per capita in the world. All have greater GDP per person than the US. More importantly, all have higher GDP per capita after subtracting off their government deficit.   

And all nine have high gross savings as a percent of GDP. As nations they consume smaller portions of what they earn. All except Austria and Finland ran trade surpluses in 2011. (In 2011, the US ran the greatest trade deficit in the world.) 

These countries are more egalitarian in wealth distribution. Their GINI coefficients (which measure how far from the center income is distributed) are all substantially lower than that of the U.S. This means there are fewer really poor people, fewer really rich people, and a lot more in the middle. (The US GINI is so high that our peers in inequality are Cameroon, Uruguay and Jamaica.)

These nine best-run countries also have more social mobility than the US as measured by how much one’s parents’ income predicts one’s own. The result is all nine countries are easier places to pull yourself up by your own bootstraps. And these nine countries aren’t over-regulated or hostile to business. Seven of the countries rank among the top 15 nations in the world for ease of doing business. 

Government
These nine countries have less government debt as a percent of GDP and they run substantially less annual deficits as a percent of GDP. Or, in the cases of Norway, Sweden and Switzerland, they run no deficits at all. In terms of national credit ratings tabulated by the World Economic Forum they rank 1, 2, 3, 4, 5, 8, 10, 12 and 13. (The US is number 11.) The same forum ranks these countries much higher than the US for protection of property, intellectual property protection, judicial independence, less favoritism in decisions of government officials, and less wasteful government spending.  

These nine countries also have more efficient legal frameworks for settling disputes, their government policy-making is more transparent, and, according  to the Corruption Index, they are among the least corrupt governments in the world. The US, though certainly not the worst on the corruption measure, doesn’t even rank as first tier.

In the Worldwide Governance Project rankings, these nine countries stood out as the most well-governed with the highest marks in the world (all higher than the US) for control of corruption, rule of law, regulatory quality, government effectiveness, political stability, absence of violence/terrorism, and voice and accountability (a measure of political participation, freedom of association, freedom of expression and a free media.)

These nine countries all have a higher percentage of women elected to their main parliament or Congress, 25% - 45% versus the US rate of 18%. (More women = better governance?  Just saying . . .) They also all have smaller parliamentary bodies (perhaps smaller = better functioning?) and each parliamentary member represents many fewer citizens (perhaps giving each individual citizen more influence and say in the political process?)

In the World Economic Council’s assessment of infrastructure, seven of the nine countries ranked higher than the US.  The rankings were: Switzerland (1), Finland (3), Austria (8), Netherlands (10), Denmark (13), Canada (15), Sweden (19), Australia (36) and Norway (39).  The US came in number 25. All nine countries ranked higher than the US in quality of electrical supply. 

The nine best-run countries all offer more weeks of paid maternity leave. (The US offers none.) In eight of these countries workers routinely get 1-4 weeks more vacation, all mandated by government policy. (The US has no legal vacation minimums.) 


These nine countries all allocate substantially more of their annual GDP in aid to foreign countries.


Military
As a percentage of their GDPs, these countries spend 1/5th to 2/5ths of what the US does. (The US spends more on its military than all other countries of the world combined.) None of these countries possess nuclear weapons. The nine countries ranked high (2, 4, 6, 9, 10, 14, 18, 22 and 28) out of 158 countries on the Global Peace Index. (The US ranked 88.) The index includes measures of internal and external stability, security and conflict.

Health
This is an area where the well-run nine run circles around the US.  They spend oodles less on health care, both per capita and as a percent of GDP. And, to top it off, their results are better! First off, they have longer life expectancies. More importantly, they also have longer expected years of healthy life.  (Which is the point of health care, right?)
They all have lower infant mortality rates. In addition, they have lower rates of obesity and diabetes, lower rates of heart disease. Most have lower rates of asthma and lung diseases of all kinds (7 countries out of 9) and alzheimers/dementia (8 out of 9). Their citizens are less likely to die from drug use, kidney disease, leukemia or birth trauma. The US cancer death rate is about average--four countries die from cancer at a lower rate than the US, five die at a higher rate. All nine countries have more practicing doctors per 1000 population than the US.  

And then there’s lifestyle impacts on health costs. Smoking and drinking don’t seem to be responsible for inflating our health care costs. Six of these countries drink more alcohol per person than we do, seven of these countries smoke more than we do. But the citizens of these countries do consume far less high fructose corn syrup per person. The US consumes 55lbs of the stuff per person per year!

In these countries people eat less meat, especially (except for Australia) beef. Their many fewer road accidents help keep health care costs down as well. (AAA estimates the costs of road accidents in the US to be $300 billion annually, or $955 per person.)  

Other factors contributing to high US health care costs are that the US has the highest rate of CT scans, MRI exams, prescription drug use, prescription drug prices, and prescription drug spending. (Over 50% of Americans take at least one prescription drug each day. 25% of US adults take four or more different prescription drugs each day!) Not all of these nine countries have single payer health care but in none of these countries is healthcare tied in any way to employment.

Crime
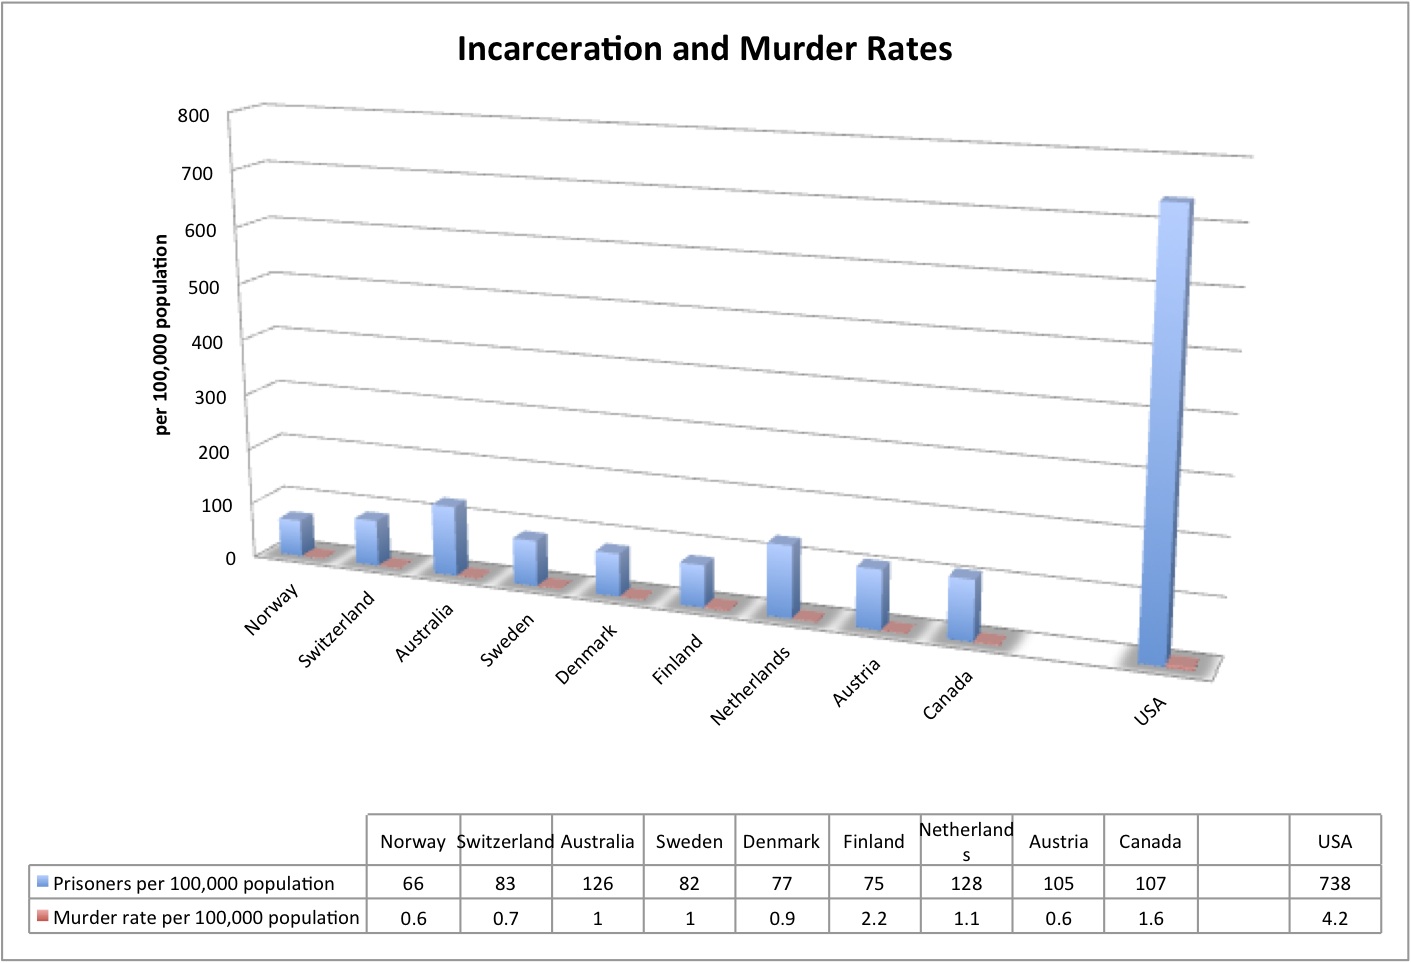
These nine countries imprison fewer people and have much lower murder rates. However, to be fair, the US is third in the world on the “Do you feel safe walking at night?” statistic. (Just behind Sweden and Canada, just ahead of Denmark, Finland and the Netherlands.) None of the nine have capital punishment.

According to the World Economic Forum, organized crime imposes much less toll on businesses in these countries. The US ranks 87 out of 144 countries on this measure, while our nine best-run countries rank 4, 12, 14, 19, 21, 22, 28, 30, and 44. On reliability of police services, they rank 1, 2, 6, 7, 8, 12, 13, 17, 18 while the US ranks 30th. On ethical behavior of firms they rank 2, 4, 5, 6, 7, 8, 9, 11, and 18 while the US ranks 29th. On auditing and reporting standards they rank 2, 6, 7, 8, 11, 12, 18, 23 and 33 while the US ranks 37th.

Transportation
All but Canada have stricter blood alcohol levels legal for driving (US and Canada--.8, Finland, Austria, Switzerland, Netherlands, Australia--.5; Sweden and Norway--.2) All but Canada use less oil per person—five (Sweden, Denmark, Switzerland, Finland and Austria) consume approximately half the oil per person as the US. Gas pump price per gallon in these countries averages $7.59, more than twice the US price ($3.75.) (Note: highest gas price is in Norway, a net oil exporter.)

People in eight of these countries make nearly four times as many trips without the use of a car as people in the US. With the exception of Canada, they walk twice as much and bike ten times as much as in the US, especially for short trips. In the US, Americans drive 85% of trips 2/3 of a mile in length (a twelve minute walk) and even 55% of trips 1/3 of a mile in length (a six minute walk.) In seven of these countries the majority of children walk or bike to school. (In the US 85% of all children are driven to school in car or bus.)

People in these nine countries have many fewer cars per capita. They travel many more miles by train.
All nine nations have auto fatality rates that are a third to two-thirds of ours. Their pedestrian fatality rates per capita are, on average, half of ours, even though they do double the walking.

Cities
These nine countries have cities with the highest quality of living in the world as calculated by the Mercer Index (2012)—they fill 5 of the top ten spots, and 16 of the top 35 spots:  Vienna, Austria (1), Zurich, Switzerland (2), Vancouver, Canada (5), Geneva, Switzerland (8), Copenhagen, Denmark (9), Bern, Switzerland (10), Sydney, Australia (11), Amsterdam, Netherlands (12), Ottawa, Canada (14), Toronto, Canada (15), Melbourne, Australia (17), Stockholm, Sweden (19), Perth, Australia. (21) Montreal, Canada (23), Helsinki, Finland (32), Oslo, Norway (32). The only US cities that rank in the top 35 are Honolulu (28) and San Francisco (29), and Boston (35).  

These countries have the greenest cities in the world.  The Siemens Green City Index rates cities based on their environmental performance and impact. Copenhagen had the highest rating in the world with (87.31) The other top city ratings were Stockholm (86.65), Oslo(83.98), Vienna (83.34), Amsterdam (83.03), Zurich (82.31,) Vancouver (81.30), Helsinki (79.29).  US cities with the highest ratings were San Francisco (83.80), New York  (79.20), Seattle (79.10) (Australian cities were not evaluated.)

Energy
Energy is a complex topic. Consumption and production patterns are influenced by each country’s mineral and hydroelectric resources as well as by their investment in various forms of energy-producing infrastructure. In the coming decades energy use will have an enormous impact on every country’s prosperity. Four of the nine countries (Norway, Denmark, Canada and Australia) are net energy exporters. Five are net energy importers like the US. Two of them (Austria and Finland) import close to two-thirds of the energy they consume.

All the countries but Norway and Canada use less total energy per person than the US (some half as much) and all use less energy for transportation. Except for Australia, they all emit less CO2 per person (some half as much). 

Sweden, Denmark and Canada in particular have made greater investments in installed solar and wind capacity per capita than the US, and the Netherlands and Austria are catching up.
In general the more coal consumed, the greater the CO2 emissions. Oil consumption also has a large impact on CO2 emissions; natural gas has less. Not surprisingly the nations that are extremely energy efficient with extensive transit and train systems tend to have the lowest CO2 emissions. (Note: TOE stands for Tons of Oil Equivalent, a way to compare different sources of energy.)

Happiness
So what in the end is a point of a government, the point of a country, if not the happiness and life satisfaction of its citizens? In the World Happiness Report produced by the Earth Institute of Columbia University, happiness and life satisfaction levels are assessed through a number of different evaluation measures. Living standards and income undoubtedly contribute to happiness but so do a person’s health (physical and mental), education, values held (such as the level of materialism or altruism), job security, meaningful work, social connections and social engagement. Or, on a more macro level, good governance, freedom (ability of citizens to choose the course of their own lives,) levels of trust in society, and levels of social mobility. (Spiritual connection/spiritual meaning and/or connection with the natural world also come into play.)  On happiness/life satisfaction scales we see Denmark (1), Finland (2), Norway (3), Netherlands (4), Canada (5), Switzerland (6), Sweden (7), Australia (9), and Austria (13) out of 150 countries, with the US coming in at (11).

What Does All This Tell Us?
Now correlation is not causation. And there are so many factors at work here it’s hard to pin down what might be cause and what might be effect. But it's pretty clear that low corruption is a prerequisite for good governance. It’s pretty clear that low CO2 emissions require reduced burning of fossil fuels. It’s pretty clear that electricity via sources other than coal and transportation via methods other than private auto result in less burning of fossil fuels. It’s pretty clear if a nation puts a disproportionate portion of its wealth towards its military and poorly-run health care system, it will have little money to put towards infrastructure such as transit, trains or renewable energy.

If we could achieve the energy efficiency of Denmark, the transportation efficiency of Sweden, the walking and biking rates of the Netherlands, the lack of government corruption of Finland, the oil consumption and transit use rates of Austria, the rail travel rates of Switzerland, the low healthcare costs and high healthy life expectancy of Australia, the low coal use of Norway, and Canada’s level of military expenditure, the US would be in extremely good shape. We could stop burning coal, end fracking, end foreign oil imports and be entirely energy self-sufficient. Our health care and energy costs would drop dramatically, as would our trade deficit. With reduced expenditure on the military, it’s even possible our national deficit would disappear. Our population would be happier, healthier, live longer, and enjoy a higher quality of life. 

To go further, if the US wants to be among the most prosperous nations on earth, we need to encourage active forms of transportation for short trips, develop transit and rail systems for longer trips, reduce income inequality and corruption, become highly energy-efficient, reduce military expenditures to 1.5% of GDP, and reduce health care expenditures to 11% of GDP. This appears to me to be the lesson of our nine best-run countries.


Sources of data:  OECD library, UN Data, BP Statistical Review of World Energy 2012, IEA Statistics 2012, EIA, CIA World Factbook, IRTAD Road Safety Annual Report 2011, Mercer Quality of Living Rankings 2012, World Happiness Report, Journal of Physical Activity and Health, Bicycling and Walking in the United States 2012 Benchmarking Report, EU Transport in Figures Statistical Pocketbook 2012, EU EDGAR data, World Economic Forum, International Transport Forum, Human Development Report 2007/2008, Global Competivenss Report 2012/2013, Renewables 2012 Global Status Report, Global Peace Index, Trends in Global CO2 emissions 2012 Report, Corruption Perception Index, The Economist, Siemens Green City Index.