Welcome

Welcome. I am the author of Universal Time, a sci-fi urban comedy;
Beaufort 1849, an historical novel set in antebellum South Carolina;
and In the Land of Porcelain, an urban comedy set in present-day San Francisco.

Friday, March 29, 2013

Behind the Spin--US Oil Production Energy Reality


There's lots of hype lately in the press about all the oil the United States is producing. Why, we’re pumping and fracking so much, soon we’ll be energy-independent and exporting oil worldwide! But it’s useful to look behind the spin and examine the true numbers of US oil production.

First off, what’s important about oil is the energy it possesses. Especially the energy available to power our transportation. (77% of all crude oil in the US goes into making fuel specifically for transportation.) Remember that word “energy.” All oil is not created equal in the energy department. Counting oil and all the various substances we classify as “oil” these days in terms of gallons and barrels tells us nothing about its energy content. In fact, talking about our oil supply in terms of volume conveniently hides the energy content. In addition, we need to consider net energy. That is, how much energy is available after the oil is drilled, pumped and refined (or after the corn is grown, transported and processed into ethanol.) If an energy source has zero net energy, then we can’t count it as additional energy available to society. It is a method of energy transfer, perhaps, but not an actual source.

Let’s look at US “oil” production. “Oil” these days includes crude oil, condensate, natural gas liquids, ethanol and refinery gains. They all have varying energy contents and are not entirely substitutable for each other. Their common denominator seems to be that they can be used to power cars. (In this respect, some day soon we may well count electricity as “oil”—after all it can make an electric car go down the block!)

This is what our total US “oil” production from 1949 to 2012 looks like:


Not bad.  We had a peak in 1970, but now we have quite a strong upward trend. OPEC watch out! But let’s consider that not all “oil” is equal in terms of energy.  Natural gas liquids have only 70% of the energy content of oil and ethanol has only 66%. Last year NGLs were 22% of our total domestic “oil” supply and ethanol was 9%. Let’s correct our energy picture for the lower energy content of these two items.  We get:


Just a little diminished, but nothing much to worry about.  Still strong. Now let’s adjust for the energy it takes to refine this oil into something we can use. It takes more energy to refine oil than we get from refinery gains, so net refinery gains don’t exist in energy terms. However, refiners have been improving the efficiency of their processes, so while refining used to use up the equivalent of 10% of all the oil energy, now it uses up only 9.1%. In addition, refineries are using more purchased steam, natural gas and electricity for power rather than their own oil products. This allows more total oil products to be produced, factoring into the higher refinery “gains.” (But still not higher than refinery losses.) Interestingly, the US counts refinery gains on imported oil as domestic production, so we have to back out the energy we spend processing foreign oil as well to get a true picture of the energy leftover after refining. We get:


Now let’s consider that it takes energy to make or capture energy. Long ago oil was so easy to drill and pump, with one barrel’s worth of energy you could get 99 out of the ground. That oil had an EROEI (Energy Returned on Energy Invested) of 99. You put in 1 and got 99 back. But the one you put in is gone, lost. You have to subtract it out of the energy picture in order to determine of how much energy is left for society (all 315 million US citizens) to use.

EROEI for oil has been shrinking since the first easy oil days. In 1949, EROEI for domestic oil was 20. By 1974 it was 18. By 1982, it had sunk down to 8, but then Alaska’s North Slope oil fields arrived on the scene and our oil EROEI popped back up to 17 for most of the 90s. But lately it’s been dropping again, and now it’s back down to almost 10. This means we have to invest one barrel of oil to get 10 out. This means we have to subtract from our total energy count one barrel’s worth of energy for every ten we get out of the ground.  

Now in the case of ethanol from corn, it takes roughly as much energy to grow, transport and process the corn into ethanol as the energy we get out of ethanol. So there is no net energy gain. Rather, ethanol is a complicated way to turn the diesel of farm equipment and trucking and the natural gas used to create fertilizer into equivalent energy that will run our cars. (And use up water and valuable farmland while we’re at it.)

In addition, even our reported crude oil is not all crude oil. Some of it is condensate that is lighter and has less energy--on average 91% of the energy of crude. In addition condensate cannot be used to make diesel or jet fuel. While condensate used to account for only 5% of our crude oil supply, now it is up to 14% of it. Adjusting for EROEI losses and condensate reduced energy content, we get this:


Not quite so bright a forecast.  But we have a few more issues to consider.  The first is that not all “oil” is used or can be turned into diesel, gasoline, or jet fuel, what we need for transportation.  We used to use less of our oil for transportation—in 1949 only 61%. (Heating oil, for instance, was a popular oil product back then.) But once oil became expensive, more and more was dedicated to transportation fuels, until today 77% of our oil (this includes imports) goes to this purpose, pretty close to the refining maximum.

In addition these days more and more of our “oil” supply is coming from natural gas liquids. NGLs used to make up 8% of our domestic oil supply; now they are 22%. Only 30% of natural gas liquids can be used to make gasoline, and none of it can be used to make diesel or jet fuel. 

So after we subtract out the oil that wasn’t used for transportation fuel in the past, the parts of crude oil that can’t be used for transportation fuel now, and the percentage of natural gas liquids that can’t be used for transportation fuel either, the energy available from our “oil” production for transportation looks like this:


Again, the gap between the lowest line and the purple line above it is actually less than it used to be because we are dedicating more of our oil to transportation. But the overall shape of the line shows why we’re still importing so much oil. Energy-wise, we only produce domestically 42% of the oil energy we use for transportation. The rest we import. If we overlook ethanol’s lack of net energy and count it as oil energy, we still produce only 45%. If we look at a graph of this over time, it’s a pretty good downward slope with a little bump at the end.


Even if we want to kid ourselves by calling lower-energy ethanol and natural gas liquids “oil,” even if we want to pretend we can count refinery gains without also counting refinery losses, even if we don’t want to recognize that every year it takes more and more energy to get the oil that’s left out of the ground, even if we ignore that ethanol transfers energy but does not provide it, even if we are unaware condensate is an increasingly higher percentage of crude oil, even if we want to believe that everything we call oil can be turned into gasoline, diesel or jet fuel, when all is said and done, reality (and net energy) prevails. It all adds up (or fails to.) The energy isn’t there.
 
Sources:  Data published by the US Energy Information Administration (1949 - 2012)

Sunday, March 17, 2013

Battle of the Curb

Draw your swords in the feisty skirmish for street space
People who don't live in San Francisco probably won't care about this (and many who do probably won't either), but it goes to show how something apparently as trifling as parking policies on just a handful of blocks can be, in the end, rather significant in terms of land use, health and quality of life. So here goes, my letter to the SFMTA.
 
Dear Folks at the San Francisco Metro Transit Authority:

I have lived on the northern edge of Noe Valley for 18 years. My husband and I have raised three children here. Next to Noe Valley and the Castro, the Mission is the neighborhood I frequent most as a destination (shops! restaurants! classes!), and it’s the neighborhood I pass through most often on my way to other destinations. In addition, having had a daughter take nearly daily dance classes at ODC for seven years, I am well acquainted with the area near the new proposed park on 17th Street. I’m also very interested in parking management policies at the SFMTA in general as it directly impacts the quality of life in San Francisco, and, by either encouraging or discouraging car use, the health and safety of all San Franciscans, including my own family’s.

In the United States motorized vehicles are a greater public health threat than guns and cigarettes combined. Every year in the US more people die from car collisions than gun violence; every year more people die from a car-induced sedentary lifestyle (via obesity, diabetes and heart disease) and poisoning from car exhaust (via asthma and lung cancer) than from cigarettes. When people don’t rely on cars for trips under 3 miles, it is easy for them to get the necessary 30 minutes of moderate physical activity each day that they need for basic health. People who rely on cars for all trips get almost no exercise and have terrible health as a result. Even the moderate amounts of walking associated with taking public transit have proven to increase the health of those who do it.


Are these the only killers?
But while cigarette smoking is subjected to ever more draconian regulation, cars are not only tolerated but encouraged at the expense of the taxpayer through subsidized parking, subsidized roads, subsidized gasoline, and, when they crash, subsidized emergency personnel and clean up crew time. In addition car drivers don’t pay for the external environmental damage their vehicles’ pollution inflicts, the health damage their exhaust inflicts, or the climate damage caused by their CO2 emissions.  With the exception of helicopters and tanks, private cars are the least energy-efficient mode of transport and the least space-efficient. Very often car drivers drive uninsured (14% in California) or drive with such low levels of insurance ($15,000) that they can’t pay for the medical costs of the bicyclists or pedestrians they hit. Even in a highly dense city like San Francisco where space is scarce and getting scarcer, we’ve made car driving the cheapest, fastest, safest, pleasantest, most direct, least effort, most convenient way to get places. Is it any wonder people choose to drive? As our city grows in population, is it any wonder there is so much conflict and friction around car storage and driving?


Until four years ago I used to drive almost everywhere I went in San Francisco. Now my husband and I bike almost everywhere, and our children bike or take public transit. Because we are a generally health family, this means that, based on San Francisco mortality statistics, being hit by a truck, bus or car is the way any member of my family is most likely to die over the next ten years. Particularly my children. Long term the air pollution caused by vehicle exhaust may also do us in. From a health perspective alone, you can see why it is in my best interests to reduce the traffic on San Francisco streets as much as possible.


More of the plan
In the region under discussion, the streets I used to drive heavily on were 20th St, South Van Ness, 14th, 15th, Folsom, and Shotwell. The streets I now bike on are Harrison, Folsom (north of 17th St.), 17th Street, 14th Street and 22nd St. I often used to hunt for parking near ODC—on Shotwell, 17th, and 18th streets.  I rarely used the lot at 17th and Shotwell. $2 might not be a high price for an hour of parking, but it’s quite high for 5 minutes to pick up or drop off a child at dance class.
My observations about the Draft NE Mission Parking Proposal released in March 2013:


Know your RPP
1)Charging for street parking is a good thing. Charging $104 per year for a residential parking permit, although better than nothing, is far too little. The city of San Francisco should be putting as much pressure as possible on the state legislature to allow the city to charge a price that makes sense depending on neighborhood density and other demands for scarce street space.  San Francisco’s density is only going to increase.  The SFMTA needs this pricing tool to have any hope of managing parking effectively.

2)The RPP (residential parking permit) zone is too narrow.  It should extend at least to Potrero Avenue. Anyone living on the blocks between the eastern edge of this zone (Alabama) and Potrero Avenue is going to be very sorry about thirty seconds after this RPP gets put in place because anyone hoping to continue with free parking will just move their vehicles there.

A new park where there used to be parking lot!
3)I am all for the new park on 17th St. Parks and green space are more important than car storage any day.

ODC teens
   4)ODC is no doubt a pain in the neck to anyone who lives on Shotwell. ODC also is a first rate modern dance company that makes a tremendous contribution to the community via their dance classes and their children and teen programs. (Really, their dance program for teens is phenomenal.)

     5)Having spent a lot of time on Shotwell between 17th and 18th, giving the ODC Dance Commons a loading zone will be a huge improvement. If the SFMTA can get passenger pick up and drop off for St. Charles School to really be on 18th instead of Shotwell, that would also improve the situation enormously. As it is stands now, Shotwell is pretty much misery between 3:30 and 4:30, and not much fun between 5:30 and 7:30. Also, if metered parking spaces really were available at these times on Shotwell, 18th  Street or 17th Street, parents might be inclined to use them rather than double-park like they do now because there is nowhere to park except the expensive, time-consuming lot.

6)Curiously, this NE Mission neighborhood is currently a car-sharing desert. City Carshare offers 3 cars and 1 pick up, and Zip car offers 6 cars and two vans, all of them around the edges of the neighborhood rather than in locations convenient to this population. To really encourage car-sharing, this neighborhood, with its density, needs to have a car available every other block.

7)The 16th and Mission BART station should make this area a transit lover’s dream. Instead, the BART plaza itself and the area immediately surrounding are unsavory at best during the day and patently unsafe at night.  If you would not want your fourteen-year-old daughter there alone just after dark, then it is not safe enough to function as a major transit destination and transfer point. If the plaza smells bad and people get harassed going to and fro, suburbanites will never take BART to, say, an ODC evening performance rather than drive. This is a crying shame.  The dysfunction of the 16th and Mission plaza without a doubt induces driving and all the negative health and neighborhood implications that entails.

8) This area would be perfect for bike share.  Really, really perfect.

9) There are quite a few unused curb cuts on Shotwell between 17th and 18th alone.

12 bikes = 1 car
10)A bike corral near the ODC Commons is an excellent idea.

11)It appears that much of the planned metered areas are not for commercial customers but rather to provide parking to employees of businesses in the area.  Especially the large ones such as PG&E, MUNI, UCSF and Comcast, all located, surprisingly, within three short, easy-to-walk blocks of BART. Charging these employees for parking rather than providing it for free is a good thing, though I wish it could be more than 50 cents an hour. However, even 50 cents an hour starts making a $72 monthly Muni pass cost-effective, and some employees may indeed begin to choose to walk, bike or take transit to work over driving if free parking is no longer an option. But given one of the employers is the City of San Francisco (at the Muni Barn) I would like to point out the savings that I, as a taxpayer, would receive from the SFMTA more actively discouraging its employees from driving to work. Driving a bus or a light rail train is an extremely sedentary job with all the associated health risks and accelerated health costs of a sedentary lifestyle. If MUNI drivers walk, bike or take transit to work (walking a few blocks on either end of their commute), they will be far healthier, their health care costs will be lower, and they will miss fewer days of work. This saves me money. If they drive to work, though we may think this is doing them a favor, these drivers will lead sicker and shorter lives. Last but not least, if our public transit system is not good enough or convenient enough for our public transit workers, who exactly is it good enough or convenient enough for? I would also point out that the health costs savings of not driving are also true for PG&E, whose employee health care costs I pay for through my utility rates. And UCSF, being a health care provider presumably cognizant of health care facts, should not allow any of its employees to drive to work just to set a good example.

12)This plan is mostly all stick and no carrot. Because the fewer cars parked in or driving through the area, the lower the friction all around to residents and businesses alike, one carrot the SFMTA could offer is this: Anyone who lives or works in the NE Mission area and who donates their car to one of  (to be determined) San Francisco charities, gets their choice of two “premium” incentives: 
a.) The Transit Package:  one free Clipper Card, 12 months of Muni A pass loaded onto card allowing unlimited travel on Muni or BART within San Francisco ($864 value), three free months of City CarShare membership, a $20 BART card, and two free Cable Car rides. 
b) The Bike Package: one free Public 7 speed bike ($449 value), one year membership to the San Francisco Bike Coalition (and all attendant member discounts), three free months of City CarShare membership, a $20 BART card, and two free Cable Car rides.

This could be advertised in flyers to residents and businesses. The incentives could also be offered to congregants of St. Charles Church, the families who attend St. Charles School, and people taking classes at ODC.  (It is possible the list of  charities to donate to could include the St. Charles School and ODC.) The flyers should also point out that by selling their car they will avoid car-related costs on average of $4500 per year (medium sedan more than 5 years old), $7500 per year (medium sedan less than 5 years old), or $11,000 per year (SUV or van less than 5 years old.)

Lost hometown treat
Anyone receiving the premiums would have to deduct the value of the Muni pass or Public bike from the tax write-off of the car donation, but since most people don’t itemize their deductions and won’t claim the write-off, it won’t matter much. The actual cost to the city would be very little, assuming you could get Public Bike (or some other bike company), the SFBC, City Carshare and BART to donate in exchange for advertising their products and/or directly recruiting new users to their services. The Cable Car rides would just be a nice treat. (Do you know how many San Franciscans actually get to ride our city’s cable cars these days? Precious few.)
 
Now, probably few in the area would take up the offer, mostly because unless their car is a junker, selling it is always going to be the better economic deal. (Unless they just don’t want the hassle of dealing with Craigslist buyers.) But even if only 10 people donated their car in exchange for the premiums, such a program would:
a) Be good PR. The city is not only taking but willing to give. 

b) Let folks know explicitly the cost of a Muni pass and what you get for it. Though we might assume everyone knows this already, people who drive everywhere very possibly do not.

c) Put the idea in people’s head that getting rid of their car might be something they want to do.

d) Put into people’s heads the idea that transit + carshare is as good as a car or bike + carshare is as good as a car

e) It might be just enough to nudge someone on the fence into taking action.

f) It would get those ten cars off the street. 

 The reason to only give the package if someone donates their car (rather than sells it) is that the donation process is much easier to track and control via the companies who do this for the charity non-profits. In addition, if someone donates a car, they then don’t get a pile of cash to buy a new one, making it far more likely to result in a net reduction of cars on the streets. The transit pass premium is more likely to be chosen since it’s a better economic deal than the bike, although anyone who realizes the convenience and health benefits of biking might choose the shiny new bike.


Spot of bicycle badness
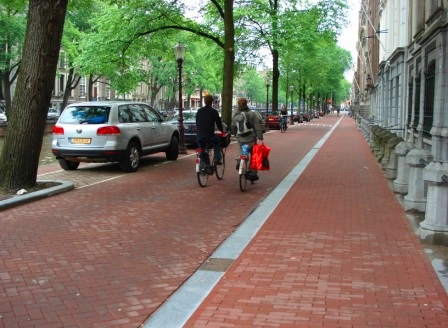
13)There needs to be bicycle infrastructure in this area that is separate and protected. Most ordinary people will not attempt to bicycle on city streets until a network of separated cycle lanes are introduced. (I would say 14th Street, 15th Street, 17th Street, Folsom, and Harrison all need them.) This means currently the average person in San Francisco is denied the convenience, economic savings and health benefits that bicycling provides. Also, more intersections need daylighting via reduced parking adjacent to the intersections to increase motorist visibility of pedestrians and bicyclists. Removing parking to accommodate these needs should probably be done now, before the SFMTA gets reliant on the income from the newly installed meters. A small point: drivers coming west on 17th cannot see the bike lane where it starts back up after the intersection at Treat and are constantly clipping it, endangering cyclists. The parking spot on the northwest corner of 17th and Treat needs to be removed to provide bicyclists more room, the bike lane needs to be painted green at least right in this area to give it better visibility to motorists, and then soft hit posts (or something even more substantial) need to be installed to protect bicyclists.

14) I am guessing fully 50% of the parking in this area will need to be RPP zone to make this plan work. (In current plan it’s more like 35%?) I am also guessing that a 50% RPP/50% commercial meters mix will reduce parking demand enough to make this a truly pleasant/safe bicycle and walking neighborhood. This in turn will reduce car parking demand and induced car driving, which in turn will make the neighborhood even more pleasant, on and on in a positive, self-reinforcing cycle. This will increase land and housing values, and the neighborhood will become family friendly, neighborly, healthy and serene. But then the MTA will be accused of insidious gentrification. I guess you can’t have everything.

Thursday, March 7, 2013

Beyond Safety: Why Women Need Separated Bike Lanes More Than Men Do

-->
Pleasant biking in Brooklyn (photo: Jim Henderson)
In the United States, a country where few people bike for transportation, one fourth of bicyclists are women. In Denmark, Germany and the Netherlands, where people bicycle 15, 20 and 30 times more than Americans (almost always for transportation) half or more of all bicyclists are female.

Why is this? Do women “perceive” safety differently than men? Is bicycling in the US much safer than women think, and if they just knew the facts they would be out there with the guys, no problem? Or are US women abnormally timid and fearful, fragile flowers that must be locked up in cars because they can’t handle any kind of exertion or risk? Or do American women have a more accurate read on safety and are wisely unwilling to spill their blood chasing an adrenaline rush like thrill-seeking men? To all these questions, I say safety is not the be all and end all of bicycling. Lack of safety may prevent bicycling, but safety alone doesn't cause bicycling. We need to think bigger and broader.


My dream  (photo: Zachary Shahan)
Statistics show that physically-separated bike lanes that crisscross the lands of bicycle-friendly nations are indeed safer for bicyclists. Denmark, Germany and the Netherlands have bicycle accident rates a fourth to a tenth of ours. (Statistics also show that the more people bike, the more the bike accident rate drops. Success breeds success.) However, if we really want women to cycle as an everyday occurrence in the US, we need to look beyond perceived safety and consider just how pleasant a woman’s experience of bicycling in her community truly is. Is biking without fear of cars hitting you important? Darn tootin’! But there are significant reasons other than safety that make biking on separated lanes a happy, enjoyable experience for women.

Typical    (photo: Streetsblog)
Let’s consider you’re riding down a standard bicycle lane in the US, one that is adjacent to traffic separated only by a painted line. You’re riding on the outer half of the lane so you don’t get “doored” if a car door swings out at you. This puts your left elbow pretty much at the edge of the bike lane. And let’s pretend there aren’t three cars double-parked in your bike lane every block forcing you out into traffic multiple times a minute.


As you ride along in your paint-created bike lane, a 10,000 lb truck passes within 8 inches of your elbow at 35mph. It doesn't hit you, merely roars by in its loud, smelly, large way. Was that particular experience unsafe? Well, no, not exactly. After all, you're fine. Was the experience unpleasant and stressful? To this question, women are going to say yes with much more frequency than men. Is this because women are big babies, and just need to gain confidence, buck up, and they'll be fine?


At your elbow.
Let's consider the sheer sensory perception differences between men and women. On average, women have better peripheral vision and men have better distance vision. When riding a bike (as opposed to driving a car) one's peripheral vision is wide-open. This means that a woman will notice the 10,000 lb truck much earlier and receive a huge negative sensory impact of its looming presence all the time it's next to her. A man might not even notice the truck until it's nearly past him. On average, it's more unpleasant and stressful for a woman to ride next to large, fast-moving objects than for a man because she perceives them sooner and more clearly. It's not timidity and it's not her imagination.


On average, women hear multiple audio sounds simultaneously, while men, especially if focused, can more easily tune out audio sources. (Wives, this is why your husband, engrossed in his computer, literally does not hear the child crying.) So if a man is concentrating on something, he may not hear the truck roaring from behind or only be vaguely conscious of it. On average a woman is likely to perceive the roar much earlier and, unable to tune it out, experience a much more unpleasant sensory overload. It's not timidity and it's not her imagination.


Breathe in
On average, women have a better sense of smell than men. On average, the nasty, stinky exhaust fumes from trucks and cars truly are more revolting to a woman than a man. It's not timidity and it's not her imagination. (And then there’s the issue of car exhaust that, at close proximity, is worse for the lungs than secondhand smoke, though as far as I know, it’s equally bad for both men and women.)


There is a reason most vehicular cyclists (bicyclists who claim bike lanes are harmful and prefer to ride with traffic) are men. On average men don't see, hear or smell the traffic the way women do, so they just don't find it as physically stressful or unpleasant. This is is not, by any means, to say there is no variation in men, or that all men find traffic pleasant. But do we really expect women to put on blinders, nose plugs and earplugs to deaden their senses enough to make bicycling tolerable? 


Things to see along the way
The irony is that biking away from car traffic is usually an extremely pleasant sensory experience. On a bike away from traffic, you can see the light filtering through the trees, you can smell flowers in bloom, you can watch the crescent moon rise in the late afternoon sky. You can hear and see birds, you can smile at a child holding her mother’s hand as she toddles down the sidewalk, you can notice the new annuals a neighbor planted in his yard. And you can experience all of this while getting your very necessary 30 minutes of moderate exercise a day in an easy joyful way. (If you live up a hill, you can still do this very pleasantly with an electric-assist bike.)


Because of the significant health benefits, because of the far less damage to the environment, because of the far lower costs of accidents, road repair, and other infrastructure, every person who walks or bikes instead of taking a car saves taxpayers money. (The city of Copenhagen reckons bicyclists save the city 42 cents per mile biked.)

Statistics show the more people drive in cars, the more obese they are. Studies show walking or biking 30 minutes a day prevents diabetes, heart disease and many forms of cancer. And it improves cognitive function as well as reduces brain atrophy, mental decline and risk of Alzheimer’s. Studies show the fitter you are in your fifties, the more years of good health you’ll have between the ages of 65 and 85. Children who walk or bike to school are able to concentrate better and have higher test scores than those who are driven. 


There’s more. Children exposed to high levels of car exhaust score more poorly on intelligence tests and are more prone to depression, anxiety and attention problems than children who grow up in cleaner air. Children born to mothers living near a major road or freeway are twice as likely to have autism. And it turns out the exhaust from leaded gasoline from the 40s, 50s, 60s and 70s very likely created the violent crime wave in US cities of the 60s, 70s, 80s and 90s. (My gosh, with China’s air pollution levels, in fifteen years that country is going up in flames.)


The US spends far more money on health care than any other nation on the planet and gets worse results than countries that spend half as much. Imported oil is a third of our trade deficit. Countries with high rates of walking and bicycling use half as much oil per person as we do. Driving or being driven everywhere is quite literally killing and bankrupting us. Short term it’s making us sick, stupid, and poor.


School transport
Why do we treat bicycles as slow cars and make them duke it out in noisy, smelly traffic? Why do we design our communities to make driving as convenient, pleasant and cheap as possible while making biking and walking miserable? Shouldn’t it be the reverse, shouldn’t the cheapest, healthiest, most non-destructive forms of transport be encouraged? Shouldn’t it always be easier to walk 10 minutes to the store than drive the same half mile? Shouldn’t it be easier and completely safe for a child to bike 10 minutes to school than their parents drive them (for fear another parent in a car will smush them?)


A quarter of all trips Americans currently take are one mile or less. Half of all trips are under three miles. Americans currently drive 70% of all trips under a mile and 90% of trips one to three miles. It takes 20 minutes to walk a mile and less than 20 minutes to bike three miles.  Again, the human body needs 30 minutes of moderate exercise a day to be healthy. Not uber-fit. Just healthy.

Now I acknowledge that a pleasant biking experience isn't everything--convenience and connectivity of bike lanes are also important. (Perhaps a future post.) But safety alone is definitely not enough.


To weep for (Copenhagenize.com)
Let pedestrians have the sidewalk. Let bicycles have a protected lane separate from traffic stress-free and secure enough for an eight-year-old to ride in. And let cars and trucks have their travel space where they won’t do pedestrians and bicyclists harm. Populations that walk and bike in large numbers are healthy. If we want Americans to bike in large numbers, we have to make biking pleasant and enjoyable to both women and men. For the benefit of all.

Monday, March 4, 2013

The Pain in the UK, France, Italy and Spain


We live in the century of energy. Though we we may not realize it, how we use energy, the sources we derive it from, and who controls these sources are already defining our politics, our wars, our economies, and our very standard of living. To comprehend the shifting fortunes of the energy landscape that even now determine how we get to the grocery store and how we heat our homes, it’s interesting to examine the per capita oil consumption of countries around the world. Last October I reported that Per Capita Oil Consumption is Dropping Like a Rock (In Some Countries).  Let’s wade into these murky waters once again to see what the last release of International Energy Agency data can tell us.

  
Let’s first look at the United States compared to the other economic powerhouses—China, Japan and Germany. In 2012, the US used 21.5 barrels of oil per person per year.  (Let call this measure BOOPPPY.) We’ve dropped! In 2007, we used 25 BOOPPPY. However, of each person’s 21.5 BOOPPPY we imported 10.3 from the world oil market. (The money we paid for this oil is subtracted from our nation's GDP.)

Now although the US is becoming more efficient with its BOOPPPY, other countries are way ahead of us on this score. Germany only used 10.5 BOOPPPY, while Japan used 13.5. China, whose economic output has been soaring the past decade, consumed only 2.65 BOOPPPY! This is likely because the US uses 70% of the oil it consumes for transportation, one of the least productive economic uses we can put it to (since internal combustion engines waste most of oil’s energy as heat.) Germany uses only 50% of its oil for transportation, Japan 45% (probably less now, because since the tsunami they are using more oil for electricity production), and China 40%. 

But even though China’s BOOPPPY is rising slowly every year, even though per person oil use in the US and Germany is falling, and even though Japan’s BOOPPPY has popped up due to shutting down their nuclear power plants, on the whole the big four aren’t nearly as interesting as what’s happening in parts of Europe. This where our drama lies.

  
However, before the theatrics, let’s examine the stable, snowy, no drama countries—Switzerland, Sweden, Denmark, Austria and Finland. These wealthy countries all use close to half the oil per person as the US. In the past few years they’ve moderately dropped their use, Finland the most aggressively. (Of course Finland was the highest to start with.) Their gradual reduction in oil use is mostly likely to due increases in efficiency and public transportation--signs of societal investment. As such, falling oil consumption can be read as an indication of strength.


Now let’s look at the UK, France, Italy and Spain. Wow. These are advanced, complex economies that along with Germany make up the core of the EU. Remember, at this stage in the world’s energy evolution, it is no easy feat to run an advanced economy with less than 10 BOOPPPY, and yet these countries have plunged well below. Oil use that in 2010 was already frugal, even by European standards, has become positively parsimonious. The IEA data I’ve derived BOOPPPY from are yearly averages, which, by their very nature, change slowly and smooth out seasonal variation. But for this graph I’ve included numbers from the month of December 2012 to give us an indication of the direction oil use might be taking. It tells us a pretty amazing story:  UK—8.3, France 9.2, Italy 7.6, and Spain 9.3.

For comparison’s sake, Mexico’s number is currently 6.7. Brazil is running around 6. Think about it: Italy is now using close to one third of the oil per person as the US. And Italy is a country where people love their cars and have lots of them. In 2001 their BOOPPPY was 13.6.

While I would like to think the drop in oil use in the UK, France, Italy and Spain is due to recent social investment in public transit and efficiency, I suspect it’s more likely due to substantial economic pain. Significantly, the less oil each country imports (without reducing their economic productivity), the better their balance of payments, and the better their financial straits become. Because these countries have had trains and transit for decades, now, when their economies are sputtering, their populations are able to forgo oil, allowing money to be spent on other things. I don't think it's an easy transition, but because of previous investment, at least it's a possible one.

(One thing I do wonder about though. If oil use in the UK oil is falling drastically--and their VMT is dropping in corresponding amounts--why were they just about the only country in EU last year with higher new car sales? How can they afford it? Are they buying new cars to sit idle in their driveways?)


There are some other economies in dire financial straits that are curiously still spending lots of money on oil per person. Let’s look at Greece and Ireland. Both countries import all their oil. Both have economies that are flailing. For Greece, at least, the US media tells story after story of extreme economic hardship. But three years ago the BOOPPPY numbers of Greece and Ireland were higher than the four wealthier countries we just looked at, and while they’ve fallen, they’re still higher. Right now they’re consuming oil per person at the levels of Denmark and Germany. Is Greece a wealthier country than Italy? Is Ireland a wealthier country than the UK? Why haven’t the economies of Ireland and Greece responded to economic pain by reducing oil use below that of their wealthier neighbors? Is their inability to reduce their oil use to UK and Italian levels making their plight even worse?

Some final questions:  how long can the US continue to use oil at a per person rate double, triple and even quintuple that of just about everyone else on the planet, including our strongest economic competitors? If the price of oil on the world market climbs, who is hurt more, countries with high BOOPPPY or low? If (or as) our economy sputters, do we become more competitive by maintaining or by reducing our rate of oil consumption?

One thing is obvious:  if consumption in the EU weren’t falling like a rock, world oil prices and the price we pay for gasoline would be a great deal higher.